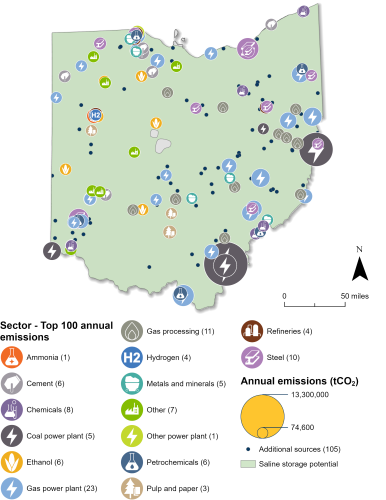
Ohio Carbon Capture Opportunities


Ohio holds significant potential for carbon management deployment, which can lower emissions across a variety of sectors in Ohio and bring jobs and private investment to the state. Of the 254 industrial and power facilities in the state, 204 are eligible for the 45Q federal tax credit. The state’s highest emitters are its coal and gas power plants, which together emit around 62 million metric tons of carbon dioxide (CO2) annually. In total, all 204 45Q-eligible facilities emit around 94 million metric tons of CO22 annually, representing 99 percent of total annual CO2 emissions in Ohio.
Ohio has taken important steps in recent years to develop a supportive regulatory and policy environment for carbon management. Governor Mike DeWine enacted a bill in 2022 requiring the state to begin the process of seeking Class VI primacy over CO2 storage wells, and the Ohio General Assembly has introduced subsequent supportive legislation.

Industrial and Power Facilities in Ohio
Ohio has 204 facilities that are eligible for the 45Q tax credit. The state’s 26 gas power and five coal power plants are its highest emitters, collectively emitting around 62 million metric tons of CO2 annually. Ohio also has 43 gas processing plants, 20 steel plants, 18 chemicals facilities, seven ethanol plants, six cement plants, and 79 other facilities that are eligible for 45Q. In total, these 204 facilities emit approximately 94 million metric tons of CO2 annually, representing 99 percent of the state’s annual CO2 emissions.
Ohio can also safely store captured CO2 underground in geologic formations, and the state currently has 11 active Class VI well applications with the US Environmental Protection Agency (EPA). The state is pursuing Class VI primacy and submitted a letter of intent to apply for funding under the EPA’s Underground Injection Control Class VI grant program in 2023. If primacy is ultimately granted, the Ohio Department of Natural Resources would assume responsibility for permitting geologic CO2 storage wells from the EPA.
Sources: EPA GHGRP, 2024. Bauer et al., NATCARB, 2018.
From 2003 to 2020, Ohio was a part of the Midwest Regional Carbon Sequestration Partnership, a project established to assess carbon capture potential, economic viability, and public acceptance of carbon storage. Through the group’s effective small-scale CO2 injection tests, the state was able to convene influential stakeholders to discuss and examine the future of carbon management in Ohio. In 2020, Ohio engaged in a new collaborative project called the Midwest Regional Carbon Initiative, which led additional carbon management research and planning.
Legislative Context for Carbon Management
Ohio has shown strong legislative support for carbon management in the last few years. In 2017, the Ohio General Assembly introduced HR 115, which urged Congress to support carbon capture projects and the expansion of the federal Section 45Q tax credit. In 2022, Ohio enacted HB 175, which included a provision requiring the Ohio Department of Natural Resources to begin the process of seeking primacy over Class VI injection wells.
Most recently, two companion bills were introduced in 2025 to build a stronger regulatory framework for carbon management in Ohio:
- SB 136 & HB 170: Designates the Division of Oil and Gas Resources Management as the sole regulator of carbon capture and storage in the state. It defines key terms, sets permit and monitoring requirements, and assigns pore space ownership to surface landowners. Operators can consolidate storage areas with 70 percent owner consent. Facilities must meet strict closure rules, with liability transferring to the state 50 years after injection ends, unless approved sooner. Operators are released from obligations post-closure, and financial assurances are returned. A 5.25-cent per metric ton fee funds long-term monitoring, and additional fees support administrative oversight.
As of May 2025, this legislation was still moving through the legislative process. For real-time updates on Ohio’s active legislation, see our State Legislative Tracker.
This bubble diagram shows the number of facilities and corresponding annual CO2 emissions for each industry in Ohio. The darker bubbles are eligible for the 45Q carbon capture tax credit, while the faded bubbles are too small to be eligible. The total amount of CO2 emissions in Ohio is listed for each industry in million metric tons.
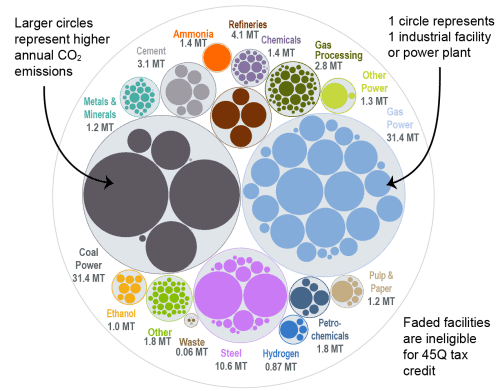
Source: EPA GHGRP, 2024.
Last updated: May 2025